Dashboard
The Dashboard page displays usage statistics for Data Generation Case (DGC) and Data Generation Suite (DGS).
Access to this page is restricted based on user authorization. Users can only view the data permitted by their assigned roles.
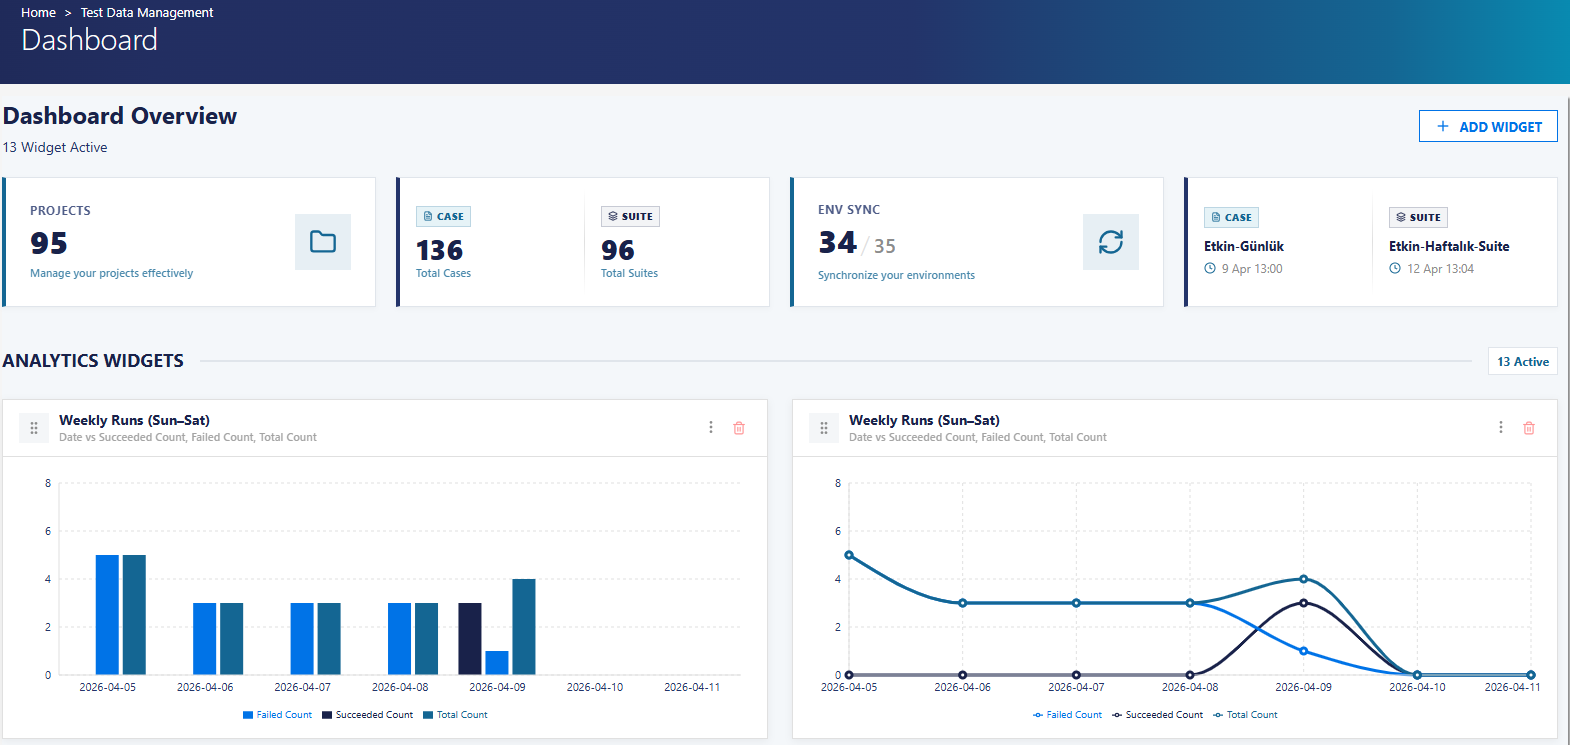
Key Features
- The dashboard has a customizable structure, allowing different visualizations based on user needs.
- Users can add, resize, delete, and rearrange widgets.
Adding a Widget
To create a new widget:
- Click Add Widget.
- Select a data source.
- Choose a visualization type.
- Configure the relevant options.
- Click Create Widget to add it to the dashboard.
Managing Widgets
Each widget includes a menu (three vertical dots) at the top-right corner, providing the following options:
- Resize the widget
- Delete the widget
Rearranging Widgets
- Widgets can be repositioned using the six-dot handle located at the top-left corner of each widget.
- Drag and drop the widget to place it as needed.
Charts
The Charts section provides visual insights into project and user activity.
The following chart types are available:
-
Project Test Case Count
Displays the total number of test cases within a project. -
Project Test Suite Count
Displays the total number of test suites within a project. -
My Hourly Runs (Today)
Shows the current user's run counts for each hour of the day, including successful, failed, and total executions. -
Weekly Runs (Sun–Sat)
Displays the total number of successful and failed runs across the week. -
My Weekly Runs (Sun–Sat)
Displays the total number of successful and failed runs for the current user over the week. -
Hourly Runs (All, Today)
Shows the hourly run counts for all users for the current day, including successful, failed, and total executions.